

Key information
DJE - Asien invests primarily in solid companies with promising growth prospects in the Asia-Pacific region. The fund management seeks to identify investments with attractive valuations and shareholder-friendly corporate policies such as capital returns and share buybacks (total shareholder return). The fund allocation is independent from market benchmark and uses decades of experience and in-depth Asian expertise of DJE research team to deliver a positive performance.
Responsible manager since inception
Responsible manager since 15/03/2024 as co-manager
Key information
| ISIN: | LU0374456811 |
| WKN: | A0Q5K0 |
| Category: | Fund Asia-Pacific Equity |
| Minimum Equity: | 51% |
| Partial Exemption of Income ¹: | 30% |
| VG/KVG: | DJE Investment S.A. |
| Fund Manager: | DJE Kapital AG |
| Risk Category: | 4 |
| This sub-fund/fund promotes ESG features in accordance with Article 8 of the Disclosure Regulation (EU Nr. 2019/2088). | |
| Type of Share: | accumulation |
| Financial Year: | 01.01. - 31.12. |
| Launch Date: | 01/08/2008 |
| Fund currency: | EUR |
| Fund Size (24/04/2024): | 85,01 Mio EUR |
| TER p.a. (29/12/2023): | 1,97% |
| Reference Index: | - |
Fees
| Management Fee p.a.: | 1,350% |
| Custodian Fee p.a.: | 0,060% |
Ratings & Awards (24/04/2024)
| Morningstar*: |
|
All ESG information presented here relates to the fund portfolio shown and is sourced from MSCI ESG Research, a leading provider of environmental, social and governance analysis and ratings.
| MSCI ESG RATING (AAA-CCC): | A |
| ESG-Qualityrating (0-10): | 6,935 |
| Environment Rating (0-10): | 5,443 |
| Social Rating (0-10): | 5,832 |
| Governance-Rating(0-10): | 5,173 |
| ESG rating in comparison group (0% lowest, 100% highest value): | 59,090% |
| Peergroup: |
Equity Asia Pacific ex Japan
(682 Fonds) |
| Coverage rate ESG rating: | 85,031% |
| Weighted average CO₂ intensity (tons of CO₂ per 1 million US dollars in sales): | 137,219 |
Portfolio allocation according to ESG rating of individual securities
Report date: 28/03/2024
- The fiscal treatment depends on the personal circumstances of the respective client and can be subject of change in the future.
- is proprietary to Morningstar and/or ist content providers may not be copied or distributed and is not warranted ob e accurate, complete or timely. Neither Morningstar nor ist content providers are responsible for any damages or losses arising from any use of this information. Past performance is no guarantee of future results.
Perfomance Chart
Performance in Percent
Rolling performance in %
Risk metrics (24/04/2024) |
|
|---|---|
| Standard Deviation (2 years): | 13,64% |
| Tracking Error (1 years): | - |
| Value at Risk (99% / 20 days): | -9,19% |
| Maximum Drawdown (1 year): | -13,32% |
| Sharpe Ratio (2 years): | -0,91 |
| Correlation (1 years): | - |
| Beta (1 years): | - |
| Treynor Ratio (1 years): | - |
Country allocation total portfolio (% NAV)
*Note: Cash position is included here because it is not assigned to any country or currency.
Data: Anevis Solutions GmbH, own illustration 28/03/2024
Top Country Allocation in % of Fund Volume (28/03/2024) |
|
|---|---|
| Japan | 34,33% |
| Cayman Islands | 18,90% |
| Taiwan, Province Of China | 8,72% |
| Bermuda | 8,14% |
| India | 7,51% |
Asset allocation in % of the fund volume (28/03/2024) |
|
|---|---|
| Stocks | 100,94% |
| Cash | -0,93% |
Investment strategy
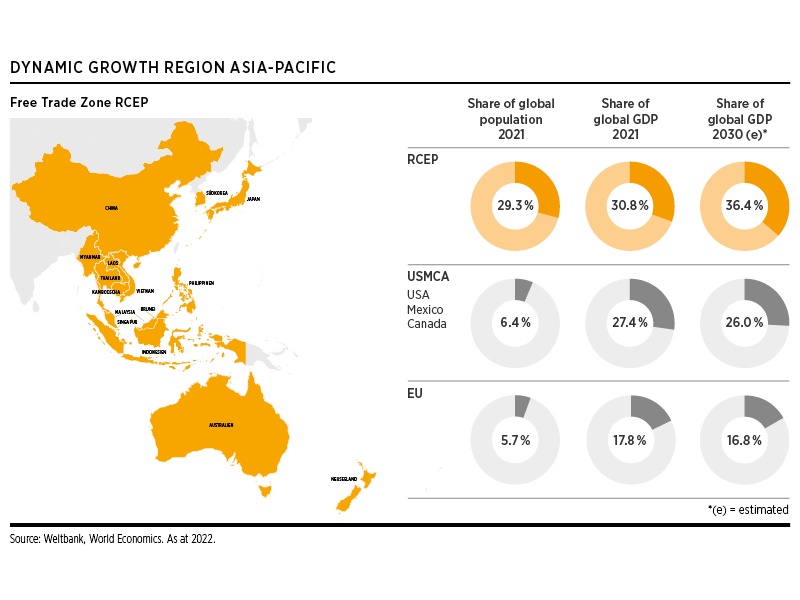
DJE - Asien invests primarily in companies with attractive and promising business models from the Asia-Pacific region. The RCEP free trade zone (Regional Comprehensive Economic Partnership), which was established in 2020, is the largest in the world in terms of its share of global GDP and is expected to contribute to the region's dynamic growth (see chart). The fund allocation is based on our proprietary fundamental top-down (FMM methodology) and bottom-up analysis. We believe that the combination of global macroeconomic analysis along with bottom-up security selection is essential to balance opportunities and risks. The focus of the fund is companies with attractive revenue and earnings growth, stable earnings, potential for innovation and a leading competitive position. The fund management allocates across regions, countries, and sectors of the Asian economic area, independent from any market benchmarks.
Chances
- Excellent demographic developments make long-term growth in investments in Asia possible
- Traditionally higher dividend payments mean that the fund can take advantage of the compounding effect of reinvested dividends
- The conditions for expansion in many Asian domestic economies, such as China, continue to exist
Risks
- Issuer country and credit risks
- Currency risks resulting from a high proportion of foreign investments
- Equity prices may exhibit relatively strong fluctuations depending on market conditions
Target group
Der Fonds eignet sich für Anleger
- who wish to reduce risk compared to a direct investment
- who seek to focus their equity investments on stocks that pay dividends
- with a medium to long-term investment horizon
Der Fonds eignet sich nicht für Anleger
- who are not prepared to accept increased volatility
- with a short-term investment horizon
- who seek safe returns
Monthly Commentary
The performance of the Asian stock markets varied in March. The stock markets in South Korea, Japan and China rose, while India, Indonesia and Hong Kong moved sideways. The "friendshoring" factor is likely to continue to play a role for the Japanese and South Korean markets. China, on the other hand, has set itself a growth target of 5% for 2024. However, this target will be more difficult to achieve than in 2023, as the previous year 2022 still suffered greatly from the consequences of China's zero-covid strategy. The Chinese government has therefore provided a fiscal stimulus. The increased spending is to be channelled into infrastructure measures on the one hand and strategic key areas such as "industries of the future" on the other. The aim is to reduce dependence on Western technologies. In this market environment, the DJE - Asien rose by 2.01%. The sub-sectors of the Asian investment region performed predominantly positively. The sectors that performed best in relative terms were Construction & Materials, Industrials (both overweighted in the fund) and Healthcare (underweighted in the fund). Disappointing results came from the property (overweight in the fund), telecommunications and technology sectors (both underweight in the fund). Overall, the sector weighting therefore had a negative impact on the fund's price performance compared to the benchmark index. The fund management made moderate adjustments to the fund's sector allocation. The overweight was increased in the chemicals, consumer goods and retail sectors. The overweight was reduced in the insurance, travel & leisure, property and industrial sectors. The underweight was reduced in the technology, financial services and automotive manufacturers & suppliers sectors. The underweight was increased in the healthcare and utilities sectors. At country level, the proportion of stocks from Japan, India and Korea increased. Conversely, the proportion of Chinese stocks listed in Hong Kong and the USA fell. As a result of the adjustments, the investment ratio rose from 96.58& to 100.94%. At the end of the month, currency hedges were in place for Hong Kong dollar-denominated stocks against the euro and the US dollar and for Swiss franc-denominated stocks against the euro.